Skip to content 
此页内容
Awesome Plots
相关信息
常见漂亮图片的绘制及代码
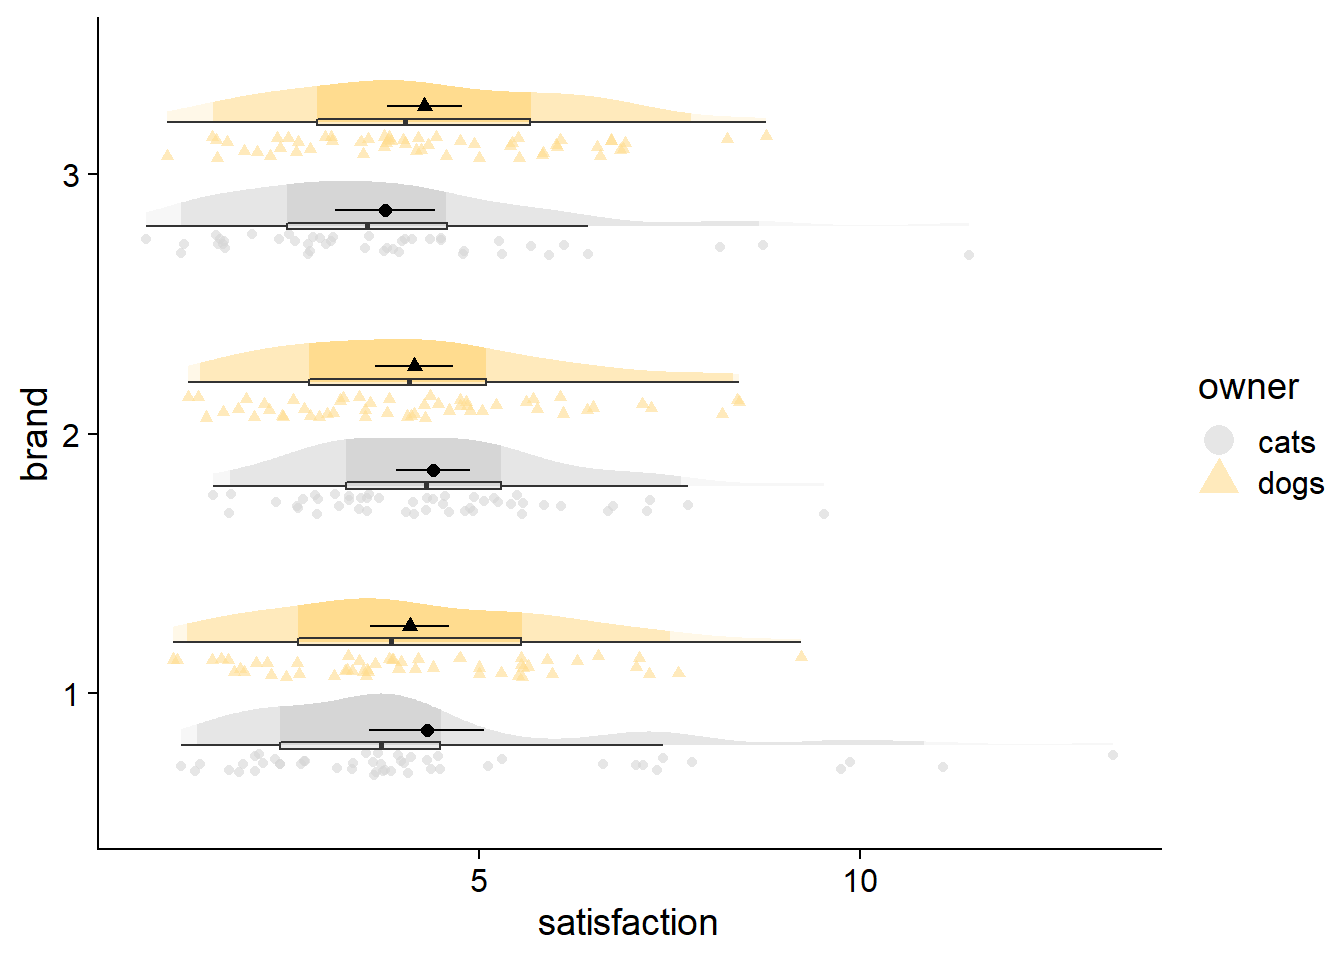
云雨图
library(tidyverse)
library(ggdist) # for shadeable density slabs
library(gghalves) # for half-half geoms
library(ggpp) # for position_dodge2nudge
library(cowplot) # for publication-ready themes
library(colorspace) # for lightening color palettes
library(gridExtra) # for grid.arrange

set.seed(1234)

df <- data.frame(satisfaction = rgamma(300, 4, 1),
                 owner = sample(c("dogs", "cats"), 300, replace = TRUE),
                brand = factor(sample(1:3, 300, replace = TRUE)))
# Setting colorblind-friendly palette
cbPalette <-c("#999999","#E69F00", "#56B4E9","#009E73",
"#F0E442", "#0072B2", "#D55E00","#CC79A7")
cbPalette <- lighten(cbPalette, amount = 0.6, space = "HLS",)
cbPalette1 <-c("#999999","#E69F00", "#56B4E9","#009E73",
"#F0E442", "#0072B2", "#D55E00","#CC79A7")
# ggplot canvas
cloudplot <- ggplot(data = df,
aes(y = satisfaction, x = brand, shape = owner, fill = owner)) +
theme_half_open() +
scale_colour_manual(values = cbPalette, aesthetics = c("colour","fill")) +
guides(fill_ramp = "none",color = guide_legend(override.aes = list(size = 5)))ggplot(data = df, aes(y = satisfaction, x = brand)) +
# density distribution slab
stat_slab(side = "both", show.legend = T,
scale = 0.6, # defines the height that a slab can reach
position = position_dodge(width=.6), # distance between elements for dodging
aes(fill_ramp = stat(level),fill=owner),
.width = c(.20, .40,.60,.80,1)) + # set quantiles for shading
# styling
scale_fill_ramp_discrete(from='black', aesthetics = "fill_ramp")+ # set ramping color
guides( # change name and display of legend elements
color="none") + # suppresses color legend item)
scale_colour_manual(values = cbPalette, aesthetics = c("colour","fill"))+
theme_half_open()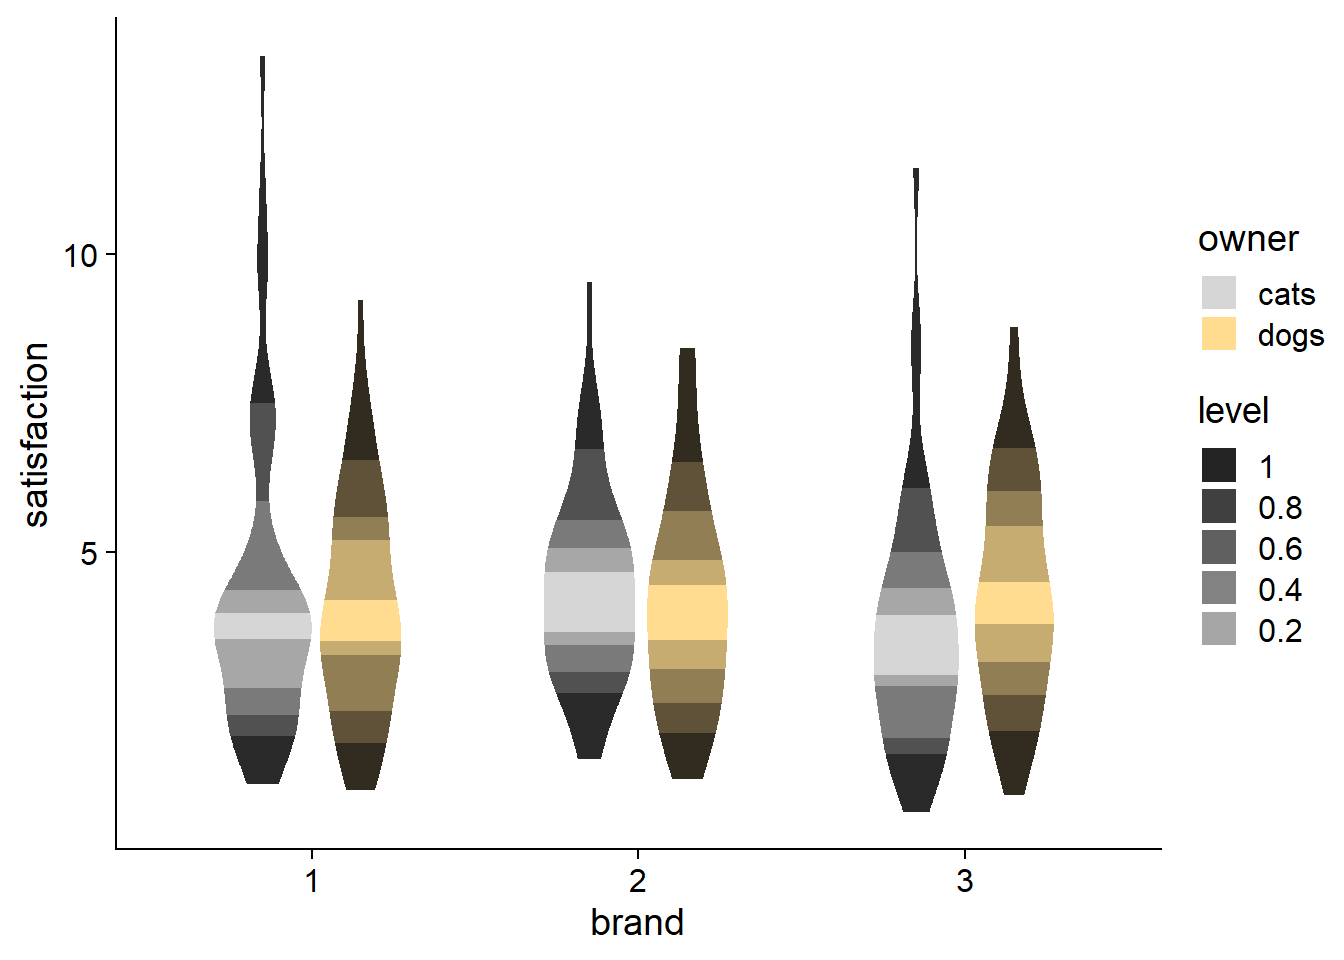
fadecloud <- cloudplot +
  stat_slab(side = "right", scale = 0.4,show.legend = F,
            position = position_dodge(width = .8),
            aes(fill_ramp = stat(level)),.width = c(.50, .95,1)) +
  # dots
  stat_dots(side = "left",scale = 0.4,show.legend = T,
            position = position_dodge(width = .8),aes(color = owner)) +
  # dot-whisker for means
  stat_summary(fun.data = "mean_cl_normal",show.legend = FALSE,size = .4,
               position = position_dodge2nudge(x=.05,width = .8))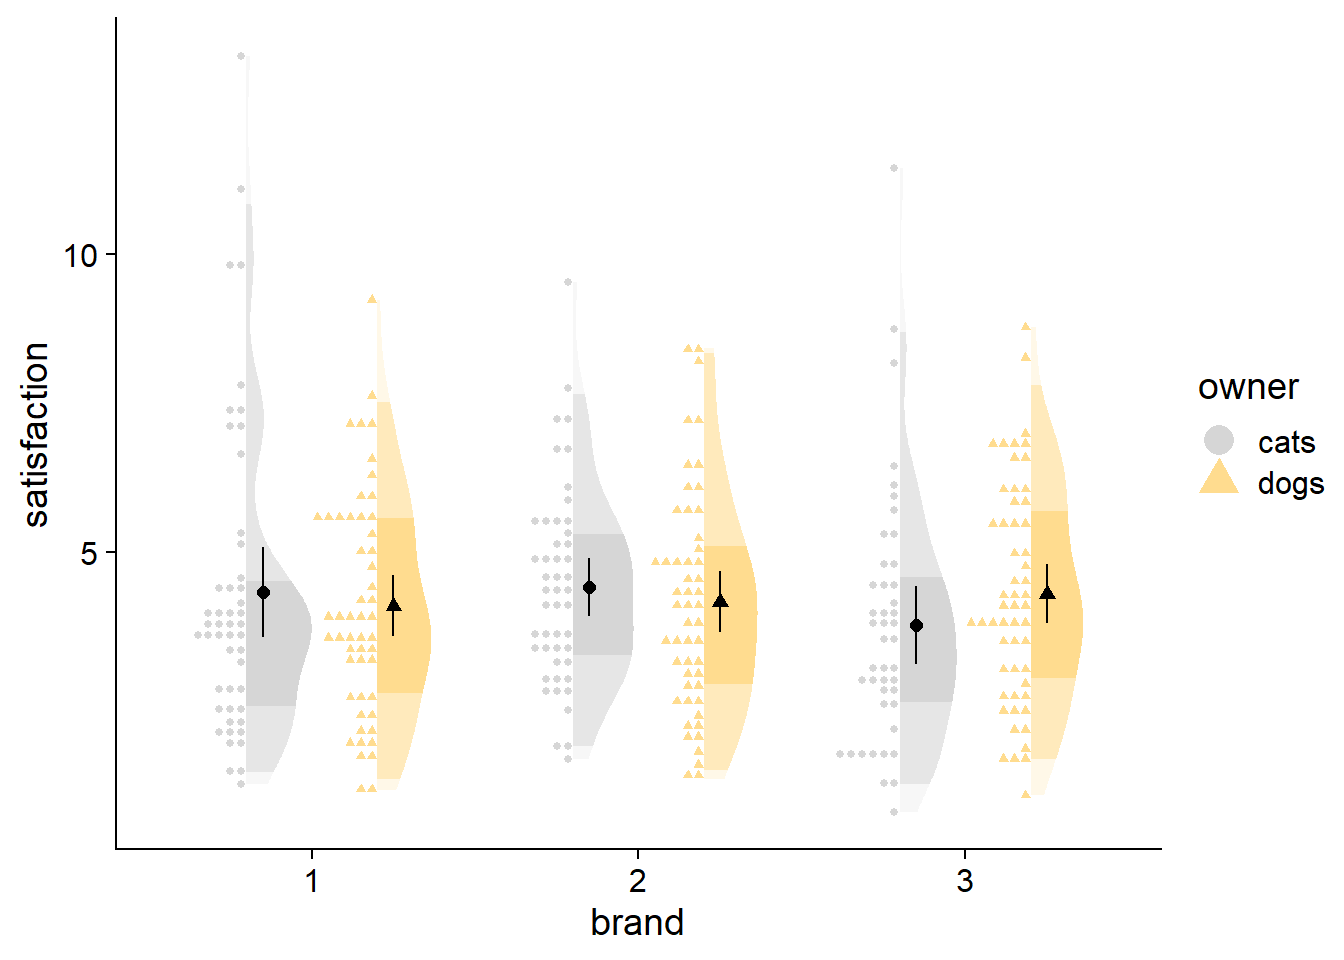
raincloud <- cloudplot +
  # density slab
    stat_slab(side = "right", scale = 0.4,show.legend = F,
            position = position_dodge(width = .8),
            aes(fill_ramp = stat(level)),.width = c(.50, .95,1)) +
  # dots
    gghalves::geom_half_point(aes(color = owner),
                            position = position_dodge2nudge(),
                            side = "l", range_scale = .5,
                            alpha = .6, size = 1.5) +
   # boxplot
     geom_boxplot(width = .05,alpha = .5,outlier.alpha=0,
               position = position_dodge(width  = .8),show.legend = FALSE) +
   # dot-whisker for means
   stat_summary(fun.data = "mean_cl_normal",show.legend = FALSE,size = .4,
               position = position_dodge2nudge(x=.06,width = .8))  +
  coord_flip()